Massey Ratings
[1]:
import sys

sys.path.append("../")
import penaltyblog as pb
[2]:
fbd = pb.scrapers.FootballData("ENG Premier League", "2020-2021")
df = fbd.get_fixtures()

df.head()
[2]:
| div | team_home | team_away | fthg | ftag | ftr | hthg | htag | htr | referee | ... | ah_ch | b365_cahh | b365_caha | pcahh | pcaha | max_cahh | max_caha | avg_cahh | avg_caha | datetime | |||
|---|---|---|---|---|---|---|---|---|---|---|---|---|---|---|---|---|---|---|---|---|---|---|---|
| competition | season | id | |||||||||||||||||||||
| ENG Premier League | 2020-2021 | 1599868800---crystal_palace---southampton | E0 | Crystal Palace | Southampton | 1 | 0 | H | 1 | 0 | H | J Moss | ... | 0.25 | 1.78 | 2.13 | 1.79 | 2.17 | 1.85 | 2.18 | 1.79 | 2.12 | 2020-09-12 15:00:00 |
| 1599868800---fulham---arsenal | E0 | Fulham | Arsenal | 0 | 3 | A | 0 | 1 | A | C Kavanagh | ... | 0.75 | 2.01 | 1.89 | 2.02 | 1.91 | 2.13 | 1.92 | 2.02 | 1.87 | 2020-09-12 12:30:00 | ||
| 1599868800---liverpool---leeds_united | E0 | Liverpool | Leeds United | 4 | 3 | H | 3 | 2 | H | M Oliver | ... | -1.50 | 1.85 | 2.05 | 1.85 | 2.08 | 1.90 | 2.16 | 1.84 | 2.04 | 2020-09-12 17:30:00 | ||
| 1599868800---west_ham---newcastle_united | E0 | West Ham | Newcastle United | 0 | 2 | A | 0 | 0 | D | S Attwell | ... | -0.50 | 2.03 | 1.87 | 2.04 | 1.88 | 2.09 | 1.91 | 2.02 | 1.86 | 2020-09-12 20:00:00 | ||
| 1599955200---tottenham_hotspur---everton | E0 | Tottenham Hotspur | Everton | 0 | 1 | A | 0 | 0 | D | M Atkinson | ... | -0.50 | 2.09 | 1.81 | 2.09 | 1.85 | 2.16 | 1.86 | 2.08 | 1.81 | 2020-09-13 16:30:00 |
5 rows × 105 columns
[3]:
massey = pb.ratings.Massey(df["fthg"], df["ftag"], df["team_home"], df["team_away"])
massey.get_ratings()
[3]:
| team | rating | offence | defence | |
|---|---|---|---|---|
| 0 | Manchester City | 1.275 | 1.486184 | -0.211184 |
| 1 | Manchester United | 0.725 | 1.238962 | -0.513962 |
| 2 | Liverpool | 0.65 | 1.10424 | -0.45424 |
| 3 | Tottenham Hotspur | 0.575 | 1.108406 | -0.533406 |
| 4 | Chelsea | 0.55 | 0.832018 | -0.282018 |
| 5 | Leicester City | 0.45 | 1.115351 | -0.665351 |
| 6 | Arsenal | 0.4 | 0.757018 | -0.357018 |
| 7 | West Ham | 0.375 | 0.952851 | -0.577851 |
| 8 | Aston Villa | 0.225 | 0.76674 | -0.54174 |
| 9 | Leeds United | 0.2 | 0.962573 | -0.762573 |
| 10 | Everton | -0.025 | 0.558406 | -0.583406 |
| 11 | Brighton & Hove Albion | -0.15 | 0.370906 | -0.520906 |
| 12 | Newcastle United | -0.4 | 0.551462 | -0.951462 |
| 13 | Wolverhampton Wanderers | -0.4 | 0.273684 | -0.673684 |
| 14 | Southampton | -0.525 | 0.586184 | -1.111184 |
| 15 | Burnley | -0.55 | 0.198684 | -0.748684 |
| 16 | Crystal Palace | -0.625 | 0.425073 | -1.050073 |
| 17 | Fulham | -0.65 | 0.037573 | -0.687573 |
| 18 | West Brom | -1.025 | 0.280629 | -1.305629 |
| 19 | Sheffield United | -1.075 | -0.13326 | -0.94174 |
[4]:
import matplotlib.pyplot as plt
import numpy as np
import seaborn as sns
%config InlineBackend.figure_format='retina'
plt.rcParams["figure.figsize"] = [10, 7]
sns.set_style("whitegrid")
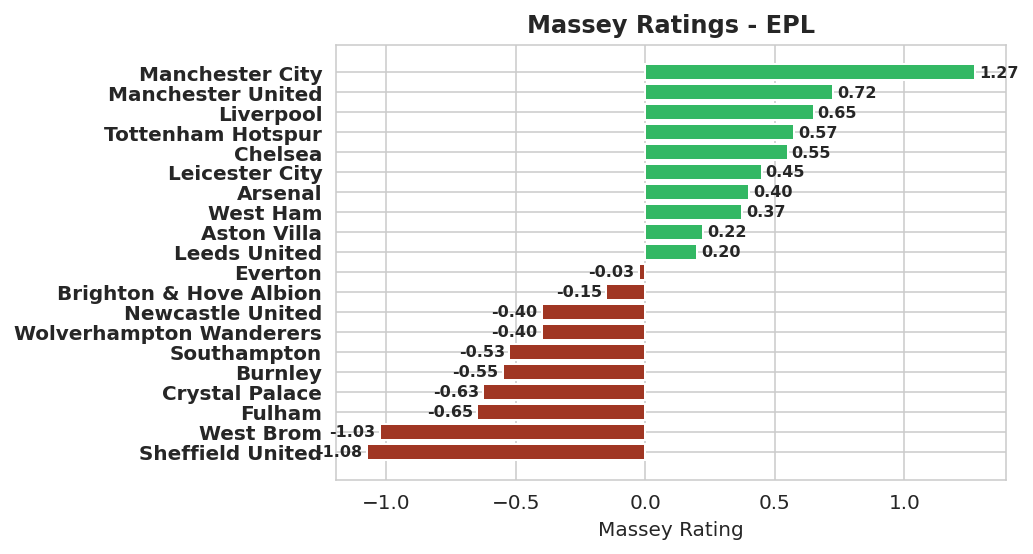
ratings = pb.massey.ratings(df["fthg"], df["ftag"], df["team_home"], df["team_away"])
ratings["colours"] = np.where(ratings["rating"] > 0, "#33b864", "#a03623")
fig, ax = plt.subplots()
y_pos = np.arange(len(ratings))
performance = ratings["rating"]
ax.barh(y_pos, performance, align="center", color=ratings["colours"])
ax.set_yticks(y_pos)
ax.set_yticklabels(ratings["team"], fontweight="bold")
ax.invert_yaxis()
ax.set_xlabel("Massey Rating")
ax.set_title("Massey Ratings - EPL", fontweight="bold")
rects = ax.patches
for rect in rects:
x_value = rect.get_width()
y_value = rect.get_y() + rect.get_height() / 2
space = 2
ha = "left"
if x_value < 0:
space *= -1
ha = "right"
label = "{:.2f}".format(x_value)
# Create annotation
plt.annotate(
label,
(x_value, y_value),
xytext=(space, 0),
textcoords="offset points",
va="center",
ha=ha,
fontsize=8,
fontweight="bold",
)
[5]:
import matplotlib.pyplot as plt
import numpy as np
import seaborn as sns
%config InlineBackend.figure_format='retina'
plt.rcParams["figure.figsize"] = [10, 7]
sns.set_style("whitegrid")
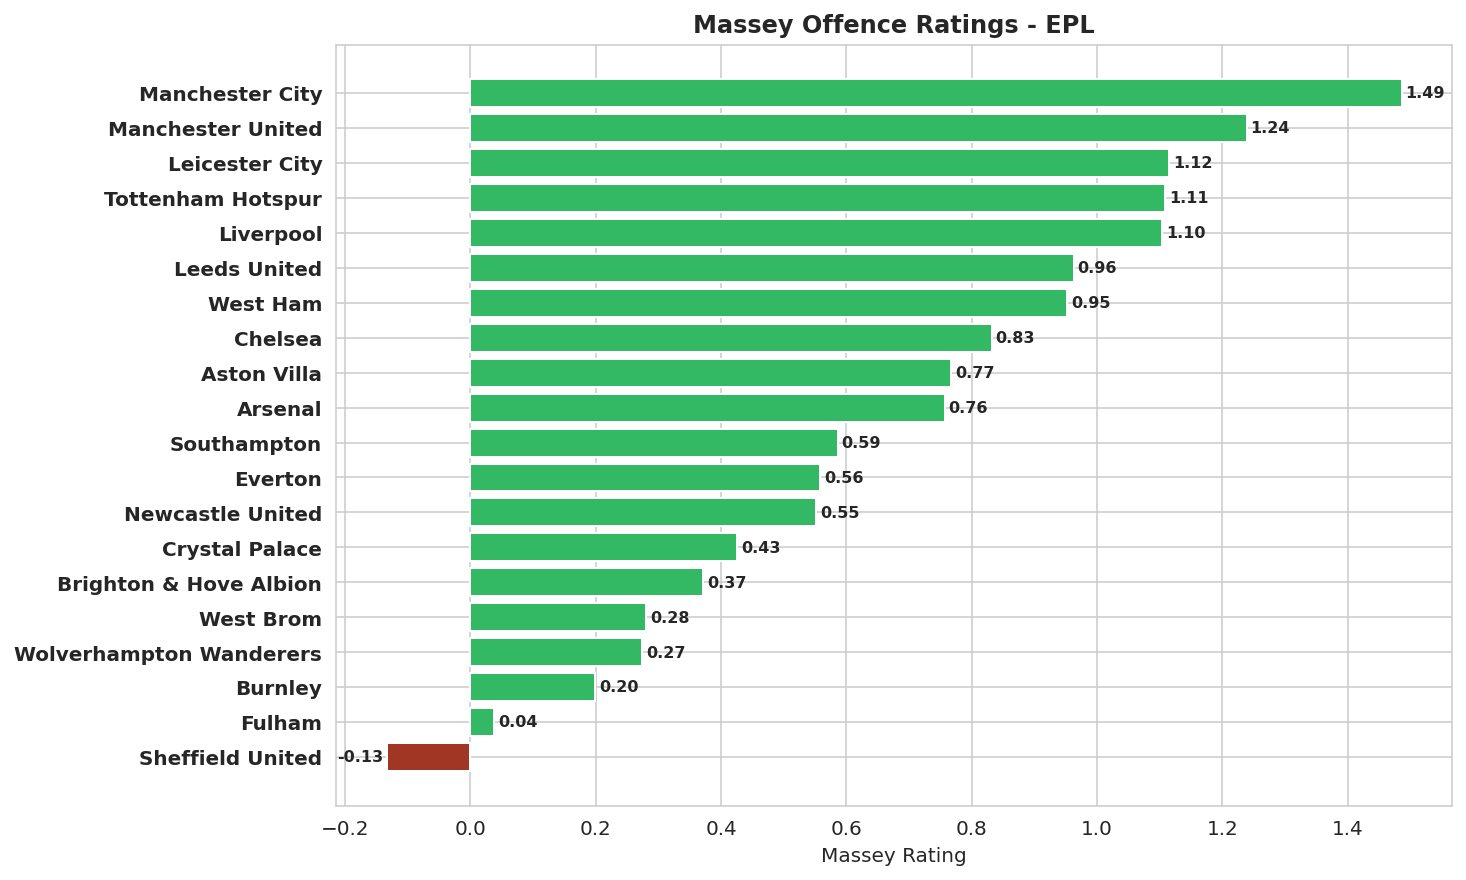
ratings = pb.massey.ratings(df["fthg"], df["ftag"], df["team_home"], df["team_away"])
ratings["colours"] = np.where(ratings["offence"] > 0, "#33b864", "#a03623")
ratings = ratings.sort_values("offence", ascending=False)
fig, ax = plt.subplots()
y_pos = np.arange(len(ratings))
performance = ratings["offence"]
ax.barh(y_pos, performance, align="center", color=ratings["colours"])
ax.set_yticks(y_pos)
ax.set_yticklabels(ratings["team"], fontweight="bold")
ax.invert_yaxis()
ax.set_xlabel("Massey Rating")
ax.set_title("Massey Offence Ratings - EPL", fontweight="bold")
rects = ax.patches
for rect in rects:
x_value = rect.get_width()
y_value = rect.get_y() + rect.get_height() / 2
space = 2
ha = "left"
if x_value < 0:
space *= -1
ha = "right"
label = "{:.2f}".format(x_value)
# Create annotation
plt.annotate(
label,
(x_value, y_value),
xytext=(space, 0),
textcoords="offset points",
va="center",
ha=ha,
fontsize=8,
fontweight="bold",
)
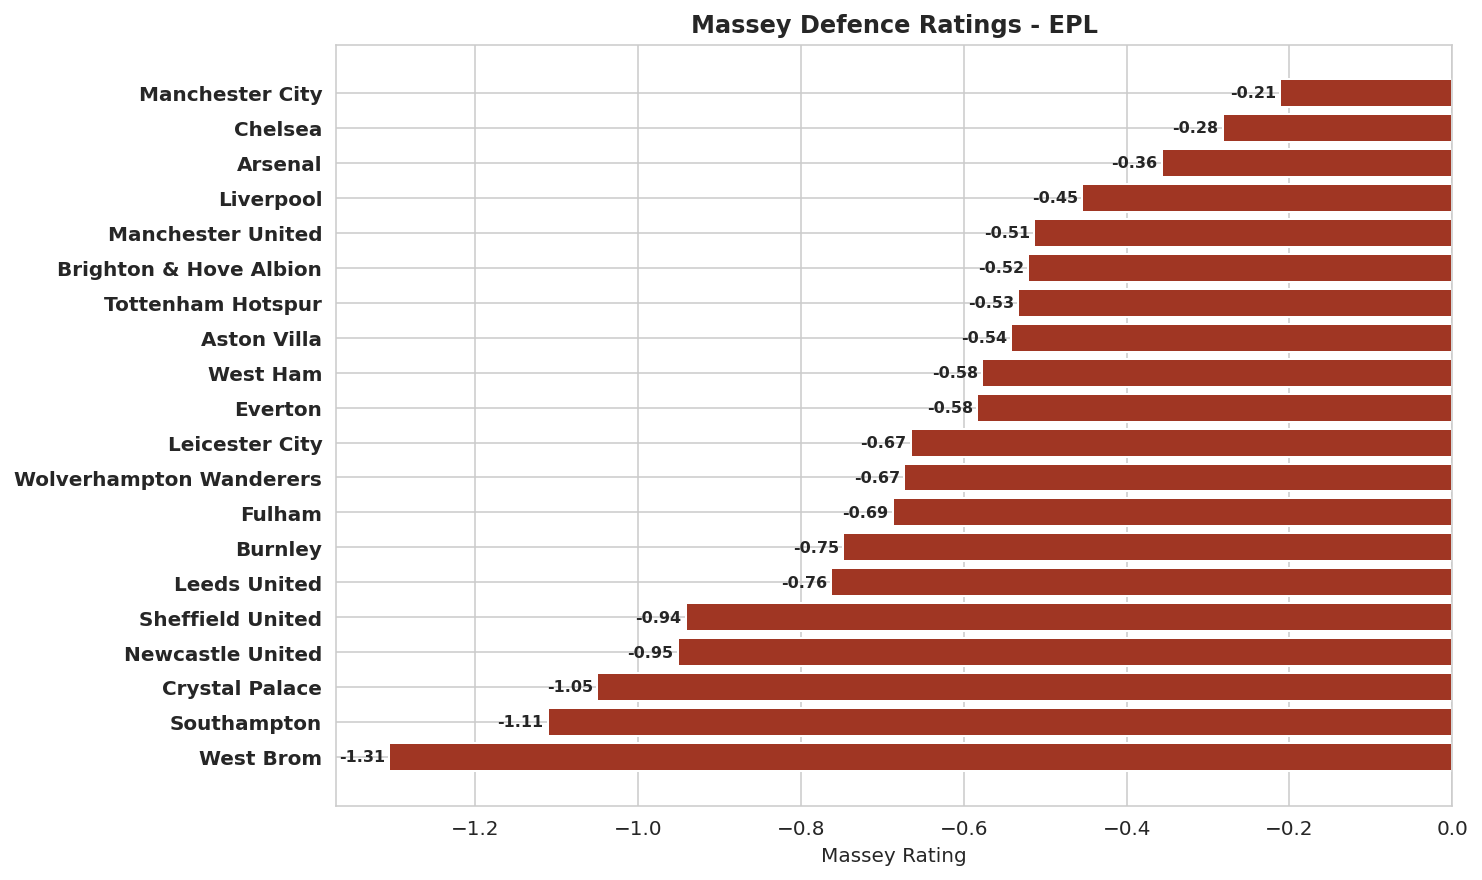
[6]:
import matplotlib.pyplot as plt
import numpy as np
import seaborn as sns

%config InlineBackend.figure_format='retina'
plt.rcParams["figure.figsize"] = [10, 7]
sns.set_style("whitegrid")

ratings = pb.massey.ratings(df["fthg"], df["ftag"], df["team_home"], df["team_away"])
ratings["colours"] = np.where(ratings["defence"] > 0, "#33b864", "#a03623")
ratings = ratings.sort_values("defence", ascending=False)
fig, ax = plt.subplots()
y_pos = np.arange(len(ratings))
performance = ratings["defence"]
ax.barh(y_pos, performance, align="center", color=ratings["colours"])
ax.set_yticks(y_pos)
ax.set_yticklabels(ratings["team"], fontweight="bold")
ax.invert_yaxis()
ax.set_xlabel("Massey Rating")
ax.set_title("Massey Defence Ratings - EPL", fontweight="bold")

rects = ax.patches

for rect in rects:
    x_value = rect.get_width()
    y_value = rect.get_y() + rect.get_height() / 2
    space = 2
    ha = "left"

    if x_value < 0:
        space *= -1
        ha = "right"

    label = "{:.2f}".format(x_value)

    plt.annotate(
        label,
        (x_value, y_value),
        xytext=(space, 0),
        textcoords="offset points",
        va="center",
        ha=ha,
        fontsize=8,
        fontweight="bold",
    )